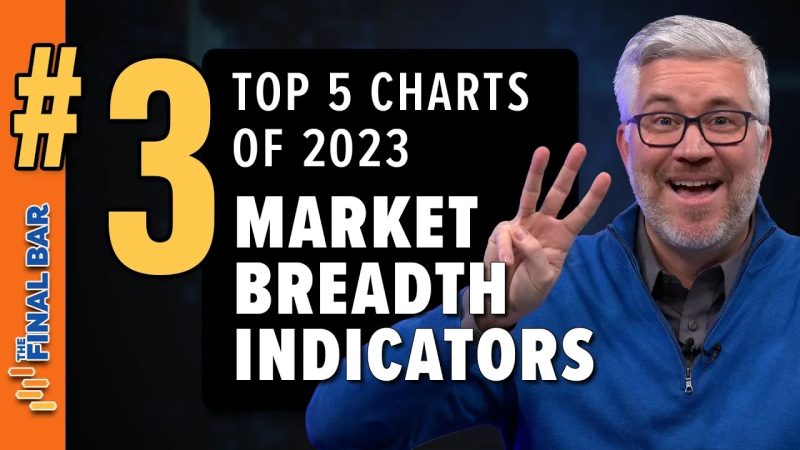
In the second of a five-part special series on StockCharts TV‘s The Final Bar, Dave breaks down three market breadth indicators that tell the story of market conditions in 2023. By analyzing the S&P 500 Bullish Percent Index, the percentage of stocks above their 50-day moving average, and the McClellan Oscillator, we’ll show how narrow leadership trends in early 2023 transitioned to a much broader advance in the fourth quarter. Most importantly, we’ll share some signals we’re looking for in early 2024!
Click here to take advantage of the StockCharts Holiday Sale!
This video originally premiered on December 20, 2023. Watch on our dedicated Final Bar page on StockCharts TV, or click this link to watch on YouTube.
New episodes of The Final Bar premiere every weekday afternoon at 4pm ET. You can view all previously recorded episodes at this link.

